

What to Know
- Shiba Inu trades below $0.000005 as declining volume and overhead moving averages reinforce bearish pressure across multiple trading timeframes.
- Four-hour charts show successive lower highs since October 7, while resistance near $0.00000526 limits recovery attempts despite recent rebounds.
- A breakdown below $0.00000480 could expose $0.00000440, while reclaiming $0.000005 remains essential for improving SHIB’s weakened technical outlook and momentum.
Shiba Inu faces renewed selling pressure as its price falls below $0.000005, weakening its technical position across three trading timeframes, with SHIB trading near $0.00000495 as declining volume and overhead moving averages complicate recovery attempts.
According to market data, the decline follows September’s failed advance toward $0.00000625, where sellers halted the token’s recovery, pushing SHIB beneath daily moving averages clustered between $0.00000526 and $0.00000545.
Those averages now act as resistance alongside the 200-day moving average near $0.00000560, while the daily Relative Strength Index stands around 40, indicating weak momentum without oversold conditions. Trading activity has also declined, leaving limited evidence of strong buying demand, while immediate support remains near $0.00000480, where SHIB recently attracted buyers.
Also Read: XRP Ledger Tokenized Assets Hit $6.3 Billion Record as RWA Volume Surges 1,458%
Lower Highs Keep Shiba Inu Under Pressure Across Multiple Charts
On the four-hour chart, SHIB has formed successive lower highs since October 7, reinforcing its short-term downtrend as rebounds repeatedly stall below declining moving averages, including resistance near $0.00000526 and $0.00000536.
We're back on X.
— 36Crypto (@36Crypto1) August 21, 2026
Our previous account (36crypto2) is currently unavailable while we continue working through the appeal process. In the meantime, this is our new official account. While you are on this page, please support us by sharing and following.
The nearest resistance stands around $0.00000502, just above the current trading price, while SHIB’s brief rebound from $0.00000480 on October 19 failed to establish a stronger recovery. Its four-hour RSI remains near 45, suggesting that a reversal lacks technical confirmation, while a four-hour close above $0.000005 would provide an initial sign of improving momentum.
The weekly chart presents a broader bearish structure dating back to early 2025, with major moving averages sloping downward and the long-term average positioned near $0.0000114. During July, SHIB established a low around $0.00000405 before entering a trading range between $0.00000450 and $0.00000650, with current prices approaching the lower boundary as weekly volume remains subdued.
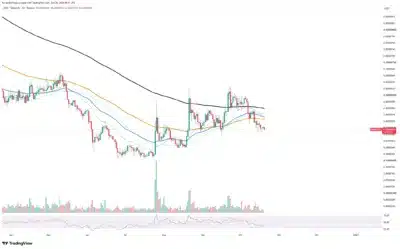
The weekly RSI also stands near 45, reflecting limited buying strength, while neither timeframe currently shows the sustained demand needed for bullish confirmation. A sustained break below $0.00000480 could expose $0.00000440 and potentially the July low, increasing the risk of further losses.
Buyers would need to reclaim $0.000005 before challenging resistance near $0.00000526, with stronger movement above these levels improving the immediate technical picture.
Also Read: Bitcoin Whale Holdings Reach Six-Month High as Santiment Reports 88,987 BTC Accumulation
