


What to Know
- Shiba Inu has fallen below its 100 EMA near $0.00000528, weakening a crucial support level and reinforcing bearish market conditions.
- Technical indicators show persistent selling pressure, with RSI near 36 and multiple moving averages creating resistance above SHIB’s current price.
- SHIB faces support at $0.00000483 and $0.00000474, while reclaiming $0.00000528 could weaken the bearish outlook and support a potential recovery.
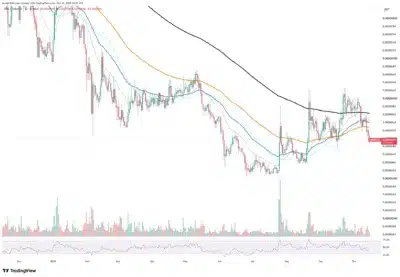
Shiba Inu (SHIB) has fallen below its 100-day exponential moving average, weakening a crucial support level as sellers push the token toward $0.00000496. According to TradingView chart data, SHIB declined from $0.00000509 to $0.00000483, breaking below the 100 EMA near $0.00000528 and establishing potential resistance.
Shiba Inu Loses 100 EMA as Selling Pressure Strengthens
Buyers defended the 100 EMA during pullbacks in late August and mid-September, supporting SHIB’s recovery toward $0.00000627 before momentum weakened. In early October, SHIB fell below the indicator and failed to reclaim it, reinforcing resistance near $0.00000528 during subsequent recovery attempts.
Also Read: Vitalik Buterin Declares Ethereum zkEVM Speed Race Over, Sets Three Security Priorities
Other moving averages remain above SHIB’s current price, with resistance near $0.00000540 and $0.00000545, while the 200 EMA stands around $0.00000562. Meanwhile, the Relative Strength Index stands near 36, reflecting persistent selling pressure, while modest trading volume suggests a gradual decline.
Source: TradingView
SHIB Faces Critical Support Test Near $0.00000474
We're back on X.
— 36Crypto (@36Crypto1) August 21, 2026
Our previous account (36crypto2) is currently unavailable while we continue working through the appeal process. In the meantime, this is our new official account. While you are on this page, please support us by sharing and following.
The immediate downside support stands at $0.00000483, matching the session’s reported low, while September’s support near $0.00000474 provides another potential buying zone. Further weakness could expose August’s support between $0.00000437 and $0.00000440, followed by the June and July lows around $0.00000405 to $0.00000410.
A decline toward these levels could erase much of SHIB’s three-month recovery, while a rebound from nearby support might provide temporary relief. Buyers must reclaim $0.00000500 before challenging the 100 EMA near $0.00000528, where a volume-supported daily close could weaken the bearish outlook.
Shiba Inu remains below key moving averages, with price movements around $0.00000483 and $0.00000474 determining whether selling pressure weakens or further declines emerge.
