


What to Know:
- APX trades near $0.99 while remaining above its lower Bollinger Band, with buyers defending the broader consolidation structure around support.
- RSI holds at 55.01, indicating moderate bullish momentum, while the $1.08634 upper Bollinger Band presents the next major resistance level.
- A breakout above $1.09 may expose $1.20, whereas stronger adoption and liquidity could support the $3 valuation target by 2030 scenario.
APX (APX) is trading near $0.99 as buyers attempt to strengthen its position around the middle Bollinger Band. The token has maintained a relatively stable structure despite several unsuccessful attempts to establish a decisive breakout above the psychological $1.00 level.
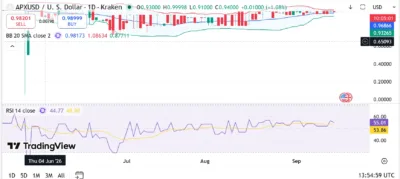
Bollinger Band readings place the middle band at $0.98173, the upper boundary at $1.08634 and the lower boundary at $0.87711. Meanwhile, the Relative Strength Index (RSI) stands at 55.01, slightly above its moving average of 53.86, indicating moderate buying momentum.
Also Read: HIVE Digital Technologies (HIVE) Stock Price Prediction 2026–2030: Can HIVE Hit $15 Soon?
APX Consolidates Near the $1 Resistance Level
APX has traded within a narrowing range following its recovery from the severe volatility recorded in June. Buyers have repeatedly defended prices around $0.90, while selling pressure has prevented a sustained advance beyond the $1.00 region.
Recent candles show limited separation between opening and closing prices, reflecting uncertainty among market participants. However, the formation of higher lows since June suggests that buyers have gradually strengthened the underlying market structure.
We're back on X.
— 36Crypto (@36Crypto1) August 21, 2026
Our previous account (36crypto2) is currently unavailable while we continue working through the appeal process. In the meantime, this is our new official account. While you are on this page, please support us by sharing and following.
Holding above the middle Bollinger Band at $0.98173 would help APX maintain its bullish positioning and challenge the $1.00 psychological barrier. A confirmed daily close above that region could encourage stronger demand toward $1.08634.
Conversely, rejection around $1.00 may return the token below the middle band. Such a move would expose support near $0.93 before sellers target the lower Bollinger Band at approximately $0.87711.
Bollinger Bands Identify the Next APX Targets
The upper Bollinger Band at $1.08634 represents the main technical resistance visible on the daily chart. APX must break this barrier with increasing trading volume before a larger bullish expansion becomes more credible.
A successful move above $1.08634 could open a pathway toward $1.15 and $1.20. These levels may attract profit-taking because traders who accumulated below $0.90 could use the advance to secure gains.
Meanwhile, the middle Bollinger Band remains an important short-term pivot. Trading consistently above $0.98173 would indicate that buyers are maintaining control, whereas repeated closes below it could weaken the bullish setup.
The lower Bollinger Band at $0.87711 provides the principal downside target if selling pressure intensifies. Nevertheless, the relatively narrow distance between the bands indicates that APX may be preparing for increased volatility once the existing consolidation ends.
RSI Shows Moderate Bullish Momentum
APX has an RSI reading of 55.01, placing the indicator above the neutral 50 threshold without entering overbought territory. This position suggests that buyers possess a modest advantage, although momentum remains insufficient to confirm a powerful breakout.
The RSI also trades above its moving average of 53.86, strengthening the argument that demand is gradually improving. Holding above both readings would support another attempt to overcome resistance around $1.00 and $1.08634.
However, a decline below 50 could indicate weakening momentum and increase the likelihood of APX revisiting $0.93. Falling beneath 40 would present a stronger bearish signal, particularly if price simultaneously loses the lower Bollinger Band.
Traders may therefore monitor whether the RSI approaches 60 during a breakout. Movement beyond that level, accompanied by rising volume, would provide stronger confirmation that buyers are driving the advance.
Source: TradingView
APX (APX) Price Prediction 2026–2030
| Year | Minimum | Average | Maximum |
|---|---|---|---|
| 2026 | $0.72 | $1.05 | $1.30 |
| 2027 | $0.88 | $1.28 | $1.65 |
| 2028 | $1.05 | $1.58 | $2.05 |
| 2029 | $1.25 | $1.95 | $2.50 |
| 2030 | $1.50 | $2.30 | $3.00 |
Price Forecast by Year
2026
Maintaining support above $0.87711 could allow APX to preserve its developing upward structure and challenge the upper Bollinger Band. A convincing breakout above $1.08634 may create room for an advance toward $1.20 and a projected maximum of $1.30.
Nevertheless, repeated rejection around $1.00 could keep APX inside an extended consolidation range. Broader cryptocurrency weakness may push the token toward its projected minimum of $0.72, particularly if buyers fail to defend the June recovery structure.
2027
Improving liquidity and stronger participation could help APX establish firmer support above $1.00 during 2027. Under favorable conditions, the token may trade at an average price of $1.28 before challenging the projected maximum near $1.65.
Achieving that valuation would require sustained demand rather than isolated speculative rallies. Limited adoption or declining market activity could instead restrict APX near the bearish estimate of $0.88.
2028
Expanding utility and greater market exposure could support an APX advance toward $2.05 in 2028. Before reaching that target, buyers would need to overcome possible resistance around $1.50 and establish a consistent pattern of higher lows.
The projected average stands at $1.58, while $1.05 represents the lower estimate. Failure to maintain prices above the $1 psychological region could weaken the long-term bullish structure and delay movement toward $2.
2029
APX could approach $2.50 if ecosystem development, liquidity and cryptocurrency market conditions remain supportive. The token may average approximately $1.95, although price fluctuations could remain substantial throughout the year.
A sustained position above $2 would strengthen the possibility of reaching the maximum forecast. Conversely, reduced demand or broader market losses could pull APX toward the projected minimum of $1.25.
2030
Under an optimistic long-term scenario, APX could reach the psychological $3 level by 2030. Moving from approximately $0.99 to $3 would require growth of slightly more than 200%, making the target achievable only with considerably stronger market demand.
The $3 projection remains speculative and depends on ecosystem expansion, improved liquidity and favorable cryptocurrency conditions. Without these catalysts, APX may trade closer to the projected average of $2.30 or the minimum estimate of $1.50.
Conclusion
APX is consolidating near $0.99 while testing the middle Bollinger Band at $0.98173. Buyers maintain a modest technical advantage, although the token must decisively overcome $1.00 and the upper band at $1.08634 to confirm further upside.
The RSI reading of 55.01 supports a moderately bullish outlook because it remains above both the neutral threshold and its 53.86 moving average. However, losing the 50 level could signal weakening demand and expose support around $0.93.
Breaking above $1.08634 may place $1.15 and $1.20 within reach, while rejection could return APX toward the lower Bollinger Band at $0.87711. Reaching $3 by 2030 remains possible under a favorable growth scenario but requires sustained adoption, liquidity and broader market strength.
FAQs
1. Is APX currently bullish?
APX shows moderate bullish momentum because its RSI stands above 50 and price trades around the middle Bollinger Band. A breakout above $1.08634 would provide stronger confirmation.
2. What is the main APX resistance level?
The upper Bollinger Band at $1.08634 represents the principal resistance level, followed by possible targets around $1.15 and $1.20.
3. What are the important APX support levels?
Immediate support stands near $0.98173 and $0.93. Stronger selling pressure could push APX toward the lower Bollinger Band at approximately $0.87711.
4. Can APX reach $3 by 2030?
APX could reach $3 under an optimistic scenario involving stronger adoption, improved liquidity and favorable market conditions, although the projection remains speculative.
5. What could weaken the APX price prediction?
Weak demand, limited ecosystem growth, rejection below $1.00 and a breakdown beneath $0.87711 could undermine the long-term APX price.
Also Read: Firo (FIRO) Price Prediction 2026–2030: Can FIRO Hit $5 Soon?
