


Summary
- Ethereum’s third-quarter recovery reached 55% as ETH reclaimed major moving averages and maintained support above its breakout zone near $2,400.
- Rising short-term averages support ETH near $2,350, while longer-term indicators create another defensive region between $2,180 and $2,250 for buyers.
- Resistance between $2,550 and $2,650 remains crucial, while weaker momentum could expose Ethereum to deeper corrective pressure if support fails.
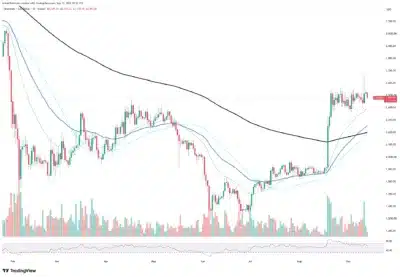
Ethereum has reclaimed major moving averages as its third-quarter recovery reaches 55% from the June low near $1,600. ETH trades around $2,492, reflecting a change from the weakness that dominated its chart earlier this year. Buyers drove the cryptocurrency above $2,000 during August, ending weeks of consolidation between $1,850 and $1,950.
Trading volume expanded during the breakout, strengthening the move as ETH advanced into the $2,400 to $2,500 range. Ethereum retained those gains and consolidated between $2,400 and $2,550.
That stability indicates sellers have not erased the August advance despite weaker momentum. The price remains comfortably above its former breakout zone, preserving the bullish quarterly structure.
Also Read: Shiba Inu On-Chain Activity Jumps 42%, but Price Signals Remain Unconvincing
Ethereum Builds Support Above Major Averages
Short-term moving averages now rise beneath ETH, creating immediate dynamic support between $2,350 and $2,400. Meanwhile, most longer-term averages remain clustered between $2,180 and $2,250, forming another important support region.
We're back on X.
— 36Crypto (@36Crypto1) August 21, 2026
Our previous account (36crypto2) is currently unavailable while we continue working through the appeal process. In the meantime, this is our new official account. While you are on this page, please support us by sharing and following.
Ethereum spent much of 2026 below its principal long-term average, limiting attempts to establish a durable recovery. Reclaiming that indicator has improved the technical outlook, although buyers must defend support during periods of increased selling pressure.
Source: TradingView
However, momentum has moderated since the powerful August breakout pushed the relative strength index into overbought territory. The RSI has returned toward the mid-50s, removing excessive pressure created by the earlier rally.
Resistance Zone Defines Ethereum’s Next Move
Ethereum now faces significant resistance between $2,550 and $2,650, an area that has repeatedly limited advances above $2,500. A confirmed move beyond $2,650 could open a route toward $2,700 and potentially bring $3,000 within reach.
Conversely, another rejection could direct ETH toward the rising support band between $2,350 and $2,400. Losing that range would expose the longer-term moving-average cluster near $2,180 to $2,250 and weaken the quarterly structure.
Ethereum’s third-quarter comeback remains technically intact while its price holds above the immediate support zone. Nevertheless, reclaiming $2,650 remains essential for extending the recovery and confirming stronger demand across the market. This balance leaves traders watching whether renewed volume can support another decisive breakout.
Also Read: HIVE Digital Technologies (HIVE) Stock Price Prediction 2026–2030: Can HIVE Hit $15 Soon?
