Last updated on May 18th, 2024 at 12:46 pm
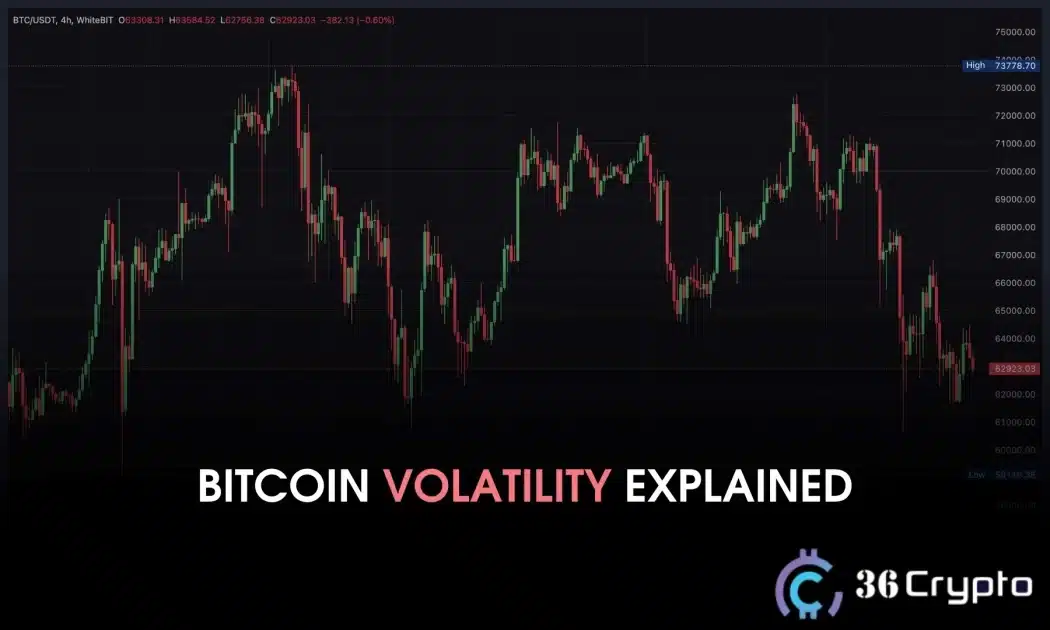
Bitcoin slumped to $61,000 shortly after seeing bullish momentum in the $71,000 range. Why can this be a worrying sign for investors?
Following the weekend’s market downsurge, Bitcoin (BTC) marked the strengthening of the bearish sentiment, retesting at the $61k price zone. The correction bias followed a loud BTC rebound, taking the largest cryptocurrency into the $71,000 range. A major reason behind its price decline since the 2nd of April was huge profit realizations, amounting to over $2.7 billion.
For over a month, domination has been constantly wandering between bulls and bears. Is BTC posed for a long-term recovery, or is it just another stage of the pre-halving volatility?
Bitcoin’s $71,000 Swift Recovery: Reasons
IT Tech, an author for CryptoQuant, cited the realization of enormous BTC profits as one of the crucial reasons for the cryptocurrency’s recovery.
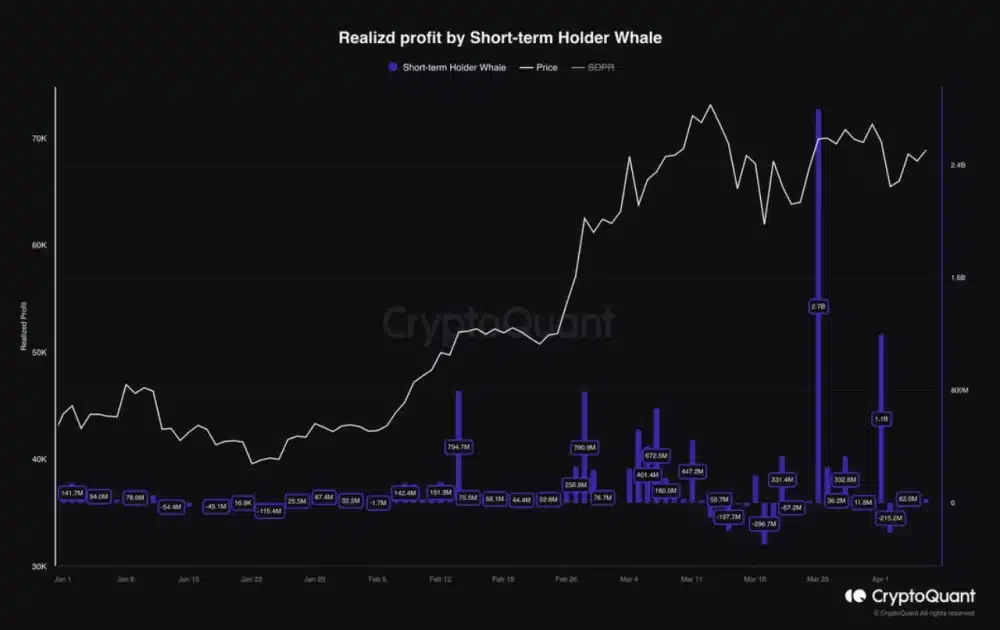
Bitcoin (BTC) realized profit by Short-term Holder Whale. Source: IT Tech/CryptoQuant
Despite this, IT Tech noted that Bitcoin experienced a drop in selling pressure as short-term holders have stopped realizing losses on the price correction. By contrast, BTC marked increased inflows into the accumulation addresses, making their reverses hit all-time highs.
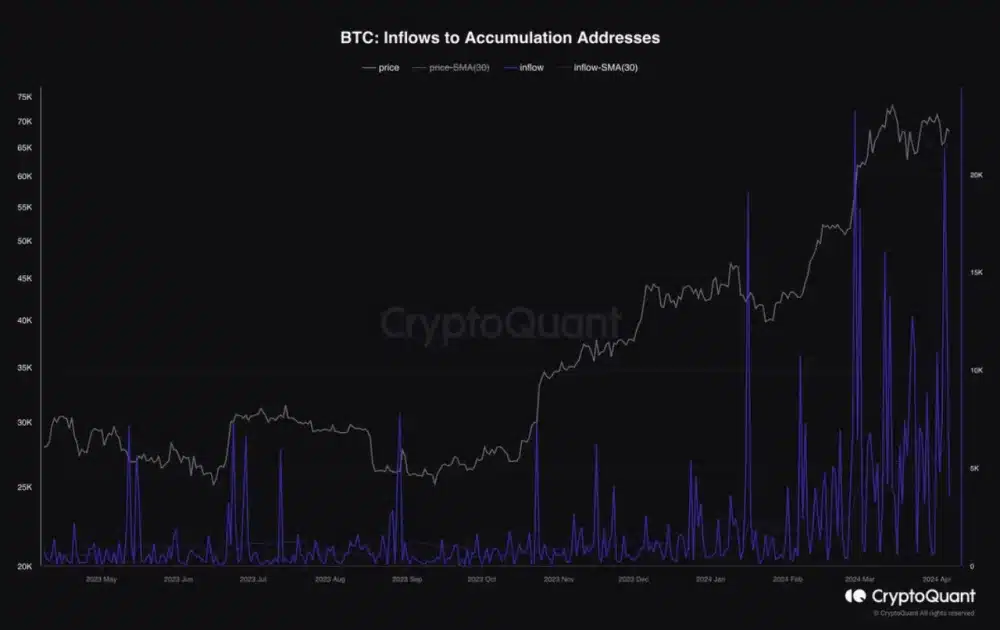
BTC inflows to accumulation addresses. Source: IT Tech/CryptoQuant
Additionally, IT Tech saw a strong BTC correlation with Tether (USDT) as a driving factor for Bitcoin’s uprising dynamics. New USDTs were minted in the recent past, which could have also contributed to BTC’s recovery above $70k.
Apart from the technical factors, the analyst highlighted the change in long-term investors’ behavior, stressing the weakening BTC distribution. The atmosphere in the market indeed changed to more festive amidst the halving anticipation, being spurred by Greed and exchange activities. Companies from CoinMarketCap to WhiteBIT crypto exchange seem to foster the community, creating a win-win situation.
Meanwhile, CoinDesk believes that the recent Bitcoin breakout comes from a higher-than-expected nonfarm payrolls report that highlights the U.S. economic resilience. For this very reason, upward dynamics were noted at Nasdaq, S&P 500, and gold.
Read Also: Weekend Recap: Stablecoins Market Capitalization, Tether’s New Project and More
Halving Correction In Action?
Even though long-term holders’ movements in the last seven days were lower than average, signaling that they were willing to hold their assets, CryptoQuant data revealed high exchange netflows. This indicates an increased selling pressure and unveils the correction, overseen by the investors. The short-term pessimism is marked via Bitcoin’s Network Value to Transactions ratio, which registered a sharp uptick.
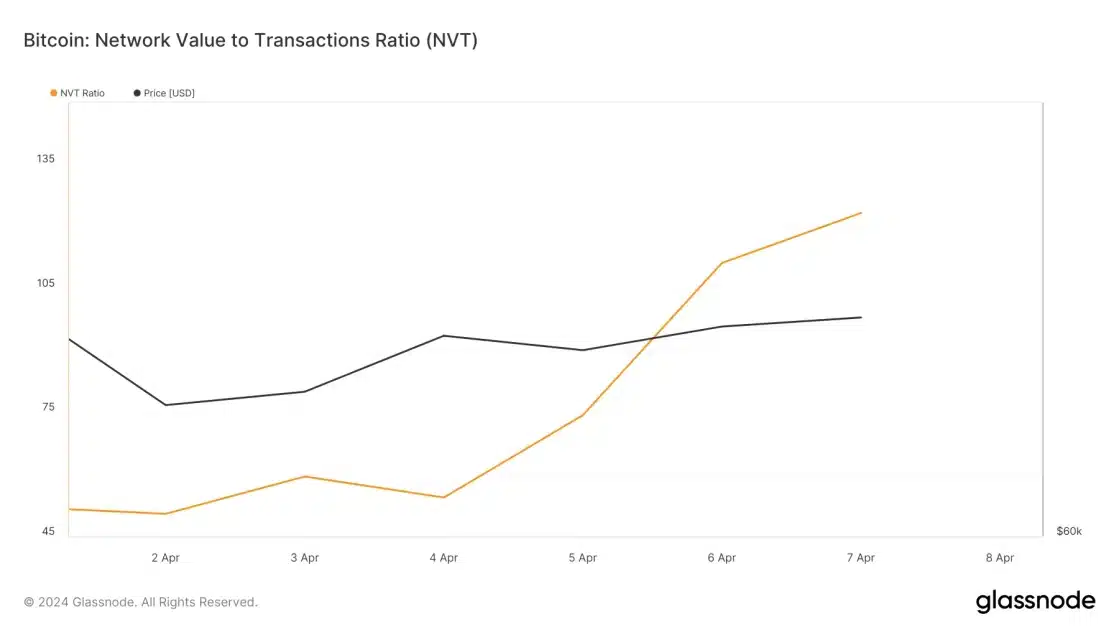
Bitcoin’s Network Value to Transactions Ratio. Source: Glassnode
Nonetheless, the long-term indicators reveal a neutral bias for BTC. Exponential Moving Averages of lengths 50, 100, and 200 register a straight movement ahead, while RSI remains in a bearish zone with a downtick, just as EMA 20.
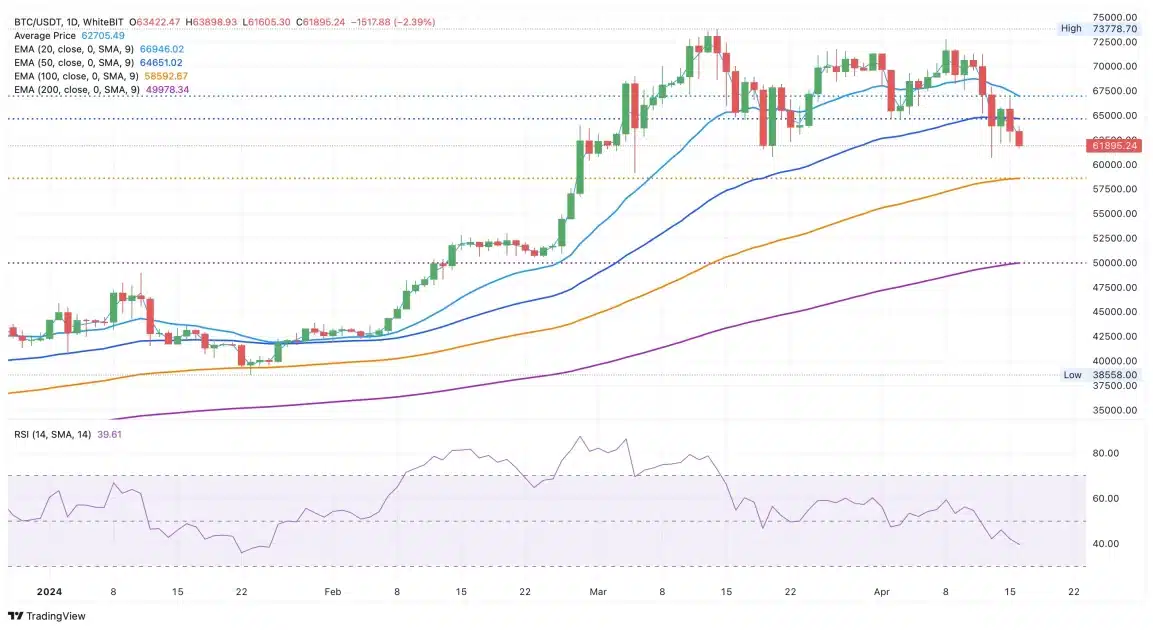
BTC/USDT 1D chart. Source: WhiteBIT Trading View
Crucially, the whole crypto market slumped amidst the outburst of Iranian aggression towards Israel, bringing greater collapse for the Bitcoin price.
Long-Term Optimism
Markus Thielen, founder of 10X Research, sees $80,000 as the next closest target for Bitcoin. In a note sent to his clients on April 8, he stated:
“If the breakout is bullish, which we suspect, bitcoin could climb above 80,000 during the next few weeks – if not earlier. Buying at $69,280 and setting a stop loss at $65,000 appears appropriate”.
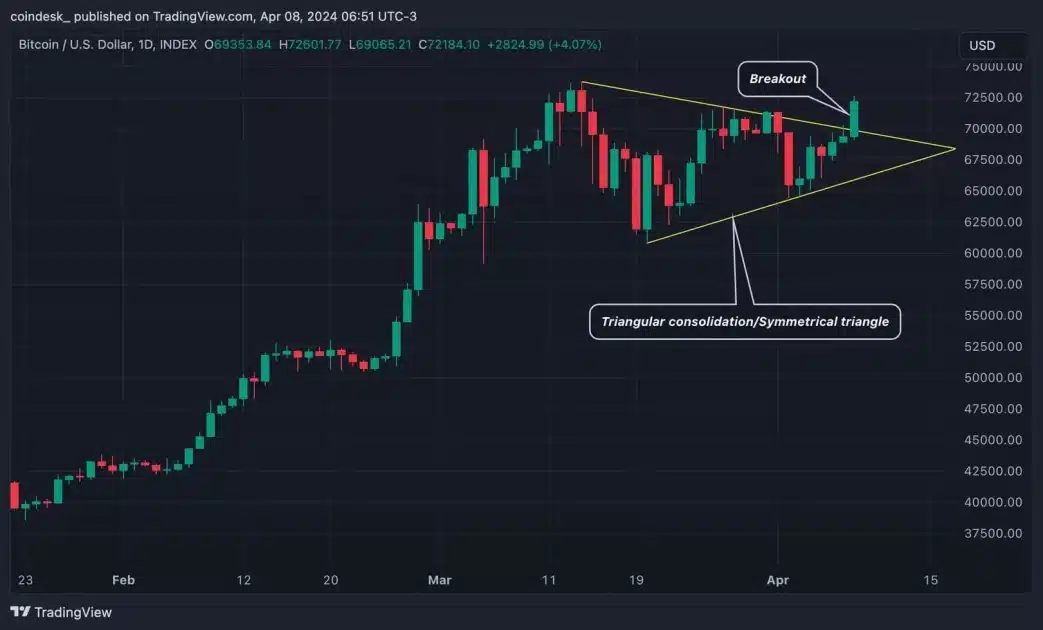
BTC/USD 1D chart. Source: CoinDesk
To support Thielen’s thesis, CoinDesk noted a bullish flag pattern on the BTC/USD daily chart. A symmetrical triangle, often called a coil, represents consolidation within a narrowing price range. The market typically builds energy during the consolidation, which is eventually unleashed in the direction in which the range is resolved. More often than not, symmetrical triangles end with a bullish breakout.
By contrast, a renowned analyst Rekt Capital predicted Bitcoin rejection from its blue Range High and foresaw the consolidation ahead.
“Bitcoin is thus sandwiched between the old all-time highs of $69000 (support) and the highs from two weeks ago of $71300 (resistance). There’s scope for consolidation here going forward, “ – he wrote in his X post.
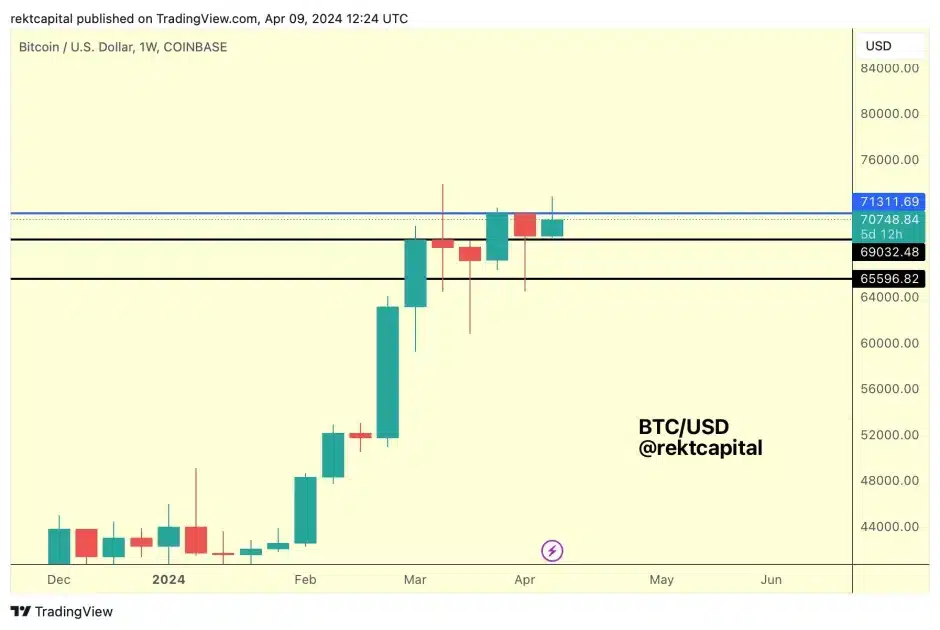
BTC/USD 1W chart. Source: X/Rekt Capital
By and large, the Bitcoin chart has all the chances to come further north, but it will be gotten through the increased volatility, as can be proven by a long-term holder’s movement.
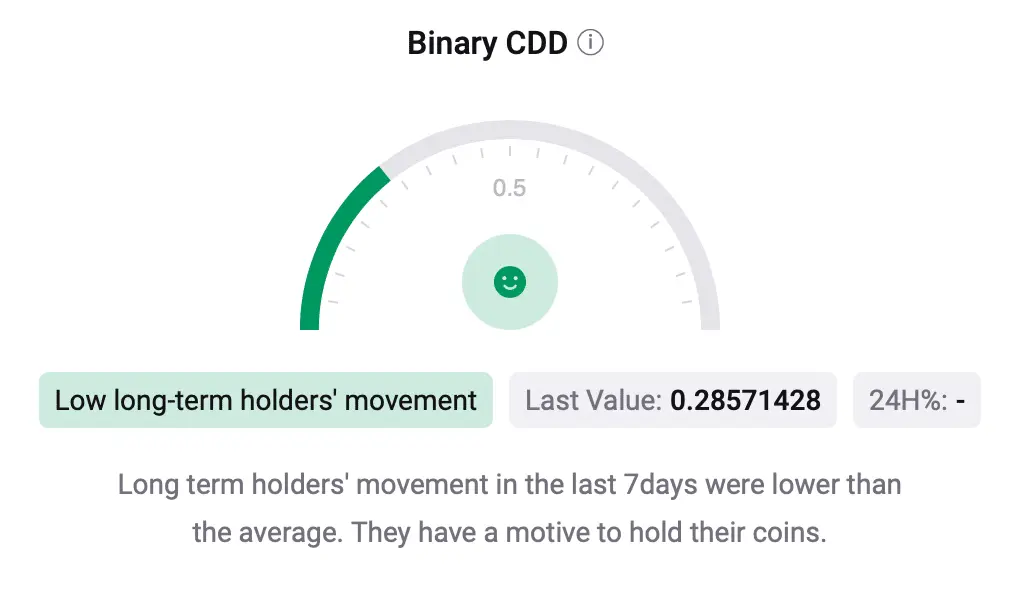
Bitcoin’s Binary Coin Days Destroyed (CDD). Source: CryptoQuant
Read Also: Interview With James Bachini on Combating Phishing Attacks in Crypto
