


- Bitcoin trades below $120,000 as breakout pressure rapidly builds.
- Technical indicators signal tight consolidation before next major move.
- Market volume drops as traders await direction with caution.
Bitcoin remains locked below the $120,000 resistance level as market tension rises and price movement tightens. The asset is trading at $119,060, hovering within a narrow band as traders prepare for a possible breakout or breakdown.
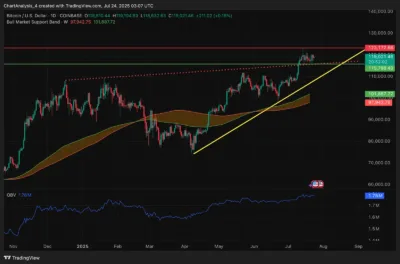
The daily chart shows Bitcoin respecting an ascending trendline that started in early May. In spite of the recurrent resistance testing at $123,000, the price has not managed to rise. This rejection has repeatedly happened, subsequently resulting in short-term profit-taking, imposing pressure on the positive movement.
A symmetrical triangle pattern has emerged on the 1-hour chart, with Bitcoin now squeezed between rising support and descending resistance. This structure shows that the market is very close to a position of making a decision, and in this case, the price is trading between $118,000 and $120,000.
Source: Tradingview
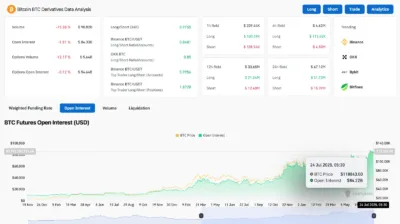
Volatility has also been slowed down in major exchanges, where a cautious mood was indicated. According to Coinglass data, the volume of trading fell by 15 percent to $90.8 billion. The open interest has also declined by 1.81 percent to $84.22 billion.
Such values indicate that traders are closing positions and waiting to be sure about the next big move.
We're back on X.
— 36Crypto (@36Crypto1) August 21, 2026
Our previous account (36crypto2) is currently unavailable while we continue working through the appeal process. In the meantime, this is our new official account. While you are on this page, please support us by sharing and following.
Source: Coinglass
Also Read: Ghana Orders Crypto Firms to Register by Aug 15 or Face Penalties
Technical Indicators Signal Imminent Market Shift
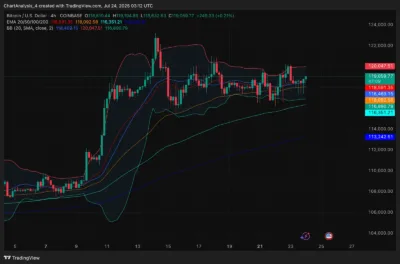
On the technical side, compression continues to dominate. The 4-hour chart shows price activity just above the 20 and 50 EMAs, while the 100 EMA provides deeper support near $116,890. Bollinger bands are being flattened, and thus, volatility may resume soon.
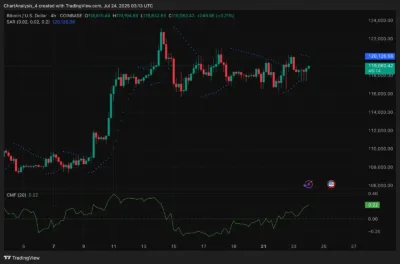
At the same time, the Parabolic SAR is over the current candles, which indicates indecision. Chaikin Money Flow is trading on a positive point of +0.20, indicating that funds are yet to stream into the market, although the movement is not great.
Source: Tradingview
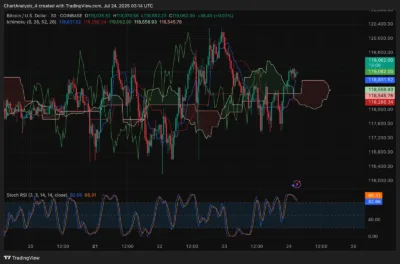
Usually, shorter timeframes are also indicative of a market in balance. Bitcoin’s current price action shows that it is consolidating on the 30-minute time frame above the Ichimoku cloud. Flat Tenkan-Sen and Kijun-Sen lines confirm the equilibrium.
Yet, the Stochastic RSI has now reached an overbought region, which suggests that a breakout is about to happen.
The 4-hour Supertrend is still bearish below $120,539. A powerful follow-through close over this mark may unleash fresh chances of a bullish run to $123000.
Bitcoin’s current price action shows tightening within a defined range as pressure mounts under $120,000. With volatility compressing and indicators signaling a decisive move, the market is preparing for a breakout that could shift short-term momentum sharply in either direction.
Also Read: Altcoins Explode as Bitcoin Stalls Below $120,000—Traders Shift Focus Fast
