


What to Know
- Zcash trades near $1,124 following a move toward $1,250, preserving its bullish structure despite weakening momentum across the cryptocurrency market.
- RSI at 74 forms a bearish divergence because ZEC reached higher price peaks while momentum failed to match the advance.
- A wide moving-average gap leaves $1,040–$1,080 as crucial support, with deeper downside levels positioned near $950 and the $800–$850 region.
Zcash (ZEC) is displaying two technical warning signals despite maintaining its bullish structure above $1,100. The privacy-focused cryptocurrency recently climbed toward $1,250 from approximately $800, delivering nearly 50% gains amid powerful demand and sustained buying pressure.
However, weakening momentum and considerable separation from major moving averages suggest ZEC could experience a deeper correction. ZEC currently trades near $1,124, having surrendered part of its latest gains.
According to TradingView chart data, the Relative Strength Index stands around 74, placing ZEC within overbought territory. More importantly, the indicator failed to match the cryptocurrency’s latest price high, creating a bearish divergence. ZEC reached approximately $880 during its August peak before breaking higher and moving beyond $1,200.
However, RSI produced a stronger reading during that earlier rally than during the latest price expansion. This divergence develops when prices establish higher peaks while underlying momentum weakens.
Also Read: Cronos Confirms $9.19 Million Remains Missing Following Tectonic Exploit
Moving Average Gap Exposes ZEC to Lower Support Levels
We're back on X.
— 36Crypto (@36Crypto1) August 21, 2026
Our previous account (36crypto2) is currently unavailable while we continue working through the appeal process. In the meantime, this is our new official account. While you are on this page, please support us by sharing and following.
Zcash’s distance from its primary moving averages represents the second warning surrounding the rally’s sustainability. The 20-day moving average stands near $847, approximately 33% below ZEC’s prevailing price.
Meanwhile, the 50-day average remains around $650, while longer trend averages sit near $614 and $512. These wide gaps demonstrate bullish strength, but they also reveal limited established support nearby.
Consequently, stronger profit-taking could trigger an accelerated decline before buyers encounter reliable demand zones. The first important support range lies between $1,040 and $1,080, corresponding with ZEC’s latest breakout area.
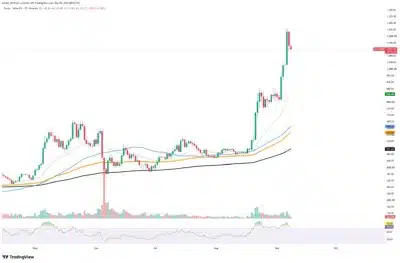
Source: Tradingview
Holding this zone could support consolidation before another advance toward $1,200 and $1,250. Conversely, losing $1,040 would expose the psychologically important $950 level.
A breakdown below $950 could direct attention toward the previous consolidation zone between $800 and $850. That region also sits near the rising 20-day average, increasing its technical importance.
ZEC remains technically bullish, although sustaining elevated prices requires stronger and more consistent demand. Maintaining $1,040 would preserve another resistance attempt, whereas a breakdown could accelerate profit-taking toward $950 or $850.
Also Read: Kansas Jayhawks Put XRP in Spotlight Following Dominant 51-6 Season-Opening Game
