


What to Know:
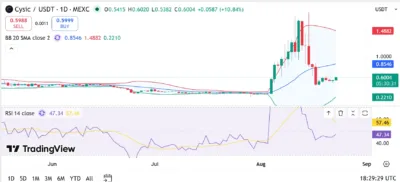
- CYS trades near $0.6004 following a 10.84% gain but remains below the $0.8546 middle Bollinger Band during its developing recovery.
- RSI has risen to 47.34, showing improving momentum, although its 57.46 average indicates buyers have not regained control completely yet.
- Reclaiming $0.8546 could expose $1.4882, while adoption, network growth and stronger demand may support a $3.00 target by 2030 eventually.
Cysic (CYS) has recorded a notable daily recovery, with the token trading around $0.6004 following a 10.84% increase. The price opened at $0.5415, reached $0.6020 and held above its intraday low of $0.5382 as buyers gradually returned.
Despite the gain, CYS remains below the middle Bollinger Band at $0.8546, showing that the broader technical structure has not turned bullish. The 14-day Relative Strength Index (RSI) stands at 47.34, below its moving average of 57.46, reflecting neutral momentum following an aggressive correction.
Also Read: Monad (MON) Price Prediction 2026–2030: Can MON Hit $0.10?
CYS Attempts Recovery After Major Price Correction
CYS previously produced a powerful rally that carried the price from approximately $0.40 to above $1.70 within several daily sessions. However, buyers could not sustain the advance, allowing intense profit-taking to return the token below $1.00.
Selling pressure later pushed CYS toward the $0.50 region before buyers established support. The latest green daily candle suggests that demand is emerging around this area, although one positive session is insufficient to confirm a lasting trend reversal.
We're back on X.
— 36Crypto (@36Crypto1) August 21, 2026
Our previous account (36crypto2) is currently unavailable while we continue working through the appeal process. In the meantime, this is our new official account. While you are on this page, please support us by sharing and following.
Holding above $0.5382 could allow CYS to challenge resistance between $0.6500 and $0.7000. A successful breakout would place the middle Bollinger Band at $0.8546 within reach, representing an important test for the recovery.
Conversely, rejection below $0.6500 could expose the recent support region around $0.5000. Losing that psychological level may encourage another decline toward the lower Bollinger Band at $0.2210.
Bollinger Bands Highlight Important Resistance
The middle Bollinger Band stands at $0.8546 and currently represents the primary technical barrier. CYS must reclaim this level with sustained trading volume before traders can consider the broader structure bullish again.
Beyond $0.8546, the upper Bollinger Band at $1.4882 would become the next major target. This level sits near the region where the earlier rally encountered increased selling pressure and could therefore attract profit-taking.
Meanwhile, the substantial distance between the upper and lower bands confirms that CYS remains highly volatile. Wider Bollinger Bands commonly appear following major price movements and indicate that sharp fluctuations may persist.
A period of consolidation between $0.50 and $0.85 could help reduce volatility and establish a stronger price base. Breaking above $0.8546 would strengthen the possibility of another advance toward $1.00 and $1.4882.
RSI Shows Neutral but Improving Momentum
CYS has an RSI reading of 47.34, placing the indicator below the neutral 50 level. Although the reading does not confirm strong bullish momentum, it shows that the token is no longer deeply overbought following its earlier surge.
The RSI also remains below its moving average at 57.46, meaning sellers still possess some technical influence. Crossing above both 50 and the indicator’s moving average would provide stronger evidence that momentum is shifting toward buyers.
However, another decline below 40 could signal weakening demand and increase the probability of CYS revisiting lower support. Traders may therefore monitor whether the RSI can sustain its recovery alongside rising price and volume.
Source: Tradingview
Cysic (CYS) Price Prediction 2026–2030
| Year | Minimum | Average | Maximum |
|---|---|---|---|
| 2026 | $0.30 | $0.75 | $1.20 |
| 2027 | $0.48 | $1.05 | $1.55 |
| 2028 | $0.70 | $1.40 | $2.00 |
| 2029 | $0.95 | $1.80 | $2.50 |
| 2030 | $1.20 | $2.20 | $3.00 |
Price Forecast by Year
2026
Maintaining support above $0.50 could help CYS build a stable recovery and challenge $0.8546. A decisive breakout above the middle Bollinger Band may create a pathway toward $1.00 and a projected maximum of $1.20.
Nevertheless, failure to preserve the current support region could return the token toward $0.30. The 2026 outlook will depend on buyer participation, liquidity and the cryptocurrency market’s broader direction.
2027
Growing interest in the Cysic ecosystem could allow CYS to establish stronger support above $1.00. Under favorable conditions, the token may reach an average price of $1.05 and a maximum near $1.55.
Such growth would require consistent development and stronger demand rather than short-lived speculative rallies. Wider market weakness could keep the price closer to the projected minimum of $0.48.
2028
Continued adoption and improved market liquidity could support an advance toward $2.00. CYS would need to overcome the earlier resistance region around $1.50 before entering this higher valuation range.
A sustained pattern of higher lows would strengthen the outlook, while repeated rejection around $1.50 could restrict the token’s average price to approximately $1.40.
2029
CYS could approach $2.50 if the project expands its ecosystem, attracts users and benefits from favorable cryptocurrency conditions. The projected average price stands at $1.80, while $0.95 represents the bearish estimate.
Volatility would likely remain substantial because the token has already demonstrated rapid price expansion and equally aggressive corrections. Investors should therefore consider both adoption progress and technical market structure.
2030
Under a strong long-term bullish scenario, CYS could reach the psychological $3.00 level by 2030. Moving from $0.6004 to $3.00 would require growth of approximately 400%.
The target remains speculative and depends on sustained network adoption, ecosystem development, stronger liquidity and favorable market conditions. Without these catalysts, CYS may trade closer to the projected average of $2.20 or minimum of $1.20.
Conclusion
Cysic is attempting to recover after a major correction, with CYS trading near $0.6004 following a 10.84% daily gain. Buyers have defended the $0.50 region, but the price remains below the middle Bollinger Band at $0.8546.
The RSI reading of 47.34 reflects improving yet neutral momentum. A move above 50 and the RSI average at 57.46 would strengthen the recovery signal, particularly if price simultaneously breaks above $0.6500.
Reclaiming $0.8546 could place $1.00 and the upper Bollinger Band at $1.4882 within reach. However, losing $0.50 may expose lower support regions, including the lower band near $0.2210.
Reaching $3.00 by 2030 is possible only under an optimistic growth scenario. CYS would require sustained adoption, greater market demand and successful breaks through several major resistance levels to achieve the projected target.
FAQs
1. Is CYS currently bullish?
CYS is showing short-term recovery signs after gaining 10.84%, but it must reclaim $0.8546 before the broader technical structure becomes bullish.
2. What is the main resistance level for CYS?
The middle Bollinger Band at $0.8546 provides the main resistance, followed by $1.00 and the upper band at $1.4882.
3. What are the important CYS support levels?
Immediate support stands around $0.5382 and $0.5000. A deeper correction could move CYS toward the lower Bollinger Band near $0.2210.
4. Can CYS reach $3 by 2030?
CYS could reach $3 under a sustained bullish scenario, although the move would require approximately 400% growth from its $0.6004 chart price.
5. What could weaken the CYS price prediction?
Declining adoption, weak liquidity, rejection below $0.8546, reduced demand and broader cryptocurrency losses could undermine the long-term CYS outlook.
Also Read: Stacks (STX) Price Prediction 2026–2030: Can STX Hit $1?
