


In Brief:
- XRP has entered a rare Gaussian Channel pattern that previously preceded major repricing events across several historical cryptocurrency market cycles.
- ChartNerd identified only seven periods beneath the weekly channel during XRP’s 13-year trading history, highlighting the formation’s exceptionally limited frequency.
- A sustained channel recovery would strengthen the bullish comparison, while rejection could prolong weakness and delay another XRP price surge.
XRP has entered a rare technical formation that previously appeared before every major repricing event. According to analyst ChartNerd, this formation – XRP trading beneath its weekly Gaussian Channel – has only happened seven times during its 13-year market history.
Earlier occurrences preceded significant price expansions linked with XRP’s market cycles in 2014, 2017, 2020, 2022, and 2024. Consequently, the formation appearing again in 2026 has attracted traders examining XRP’s broader structure and possible recovery prospects. However, the repeated pattern does not guarantee an immediate surge because every market cycle develops under different financial conditions.
Also Read: Cardano Founder Charles Hoskinson Says AI’s Math Progress Surpassed Expectations
Only 7 times in 13 years has $XRP spent periods of time accumulating under the weekly Gaussian Channel. Every period of price action below this indicator eventually lead to all major repricing events: 2014, 2017, 2020, 2022, 2024, and now here we are again in 2026.. https://t.co/A5Vl28LEm7
— 🇬🇧 ChartNerd 📊 (@ChartNerdTA) September 8, 2026
Gaussian Channel Repeats XRP’s Historical Accumulation Structure
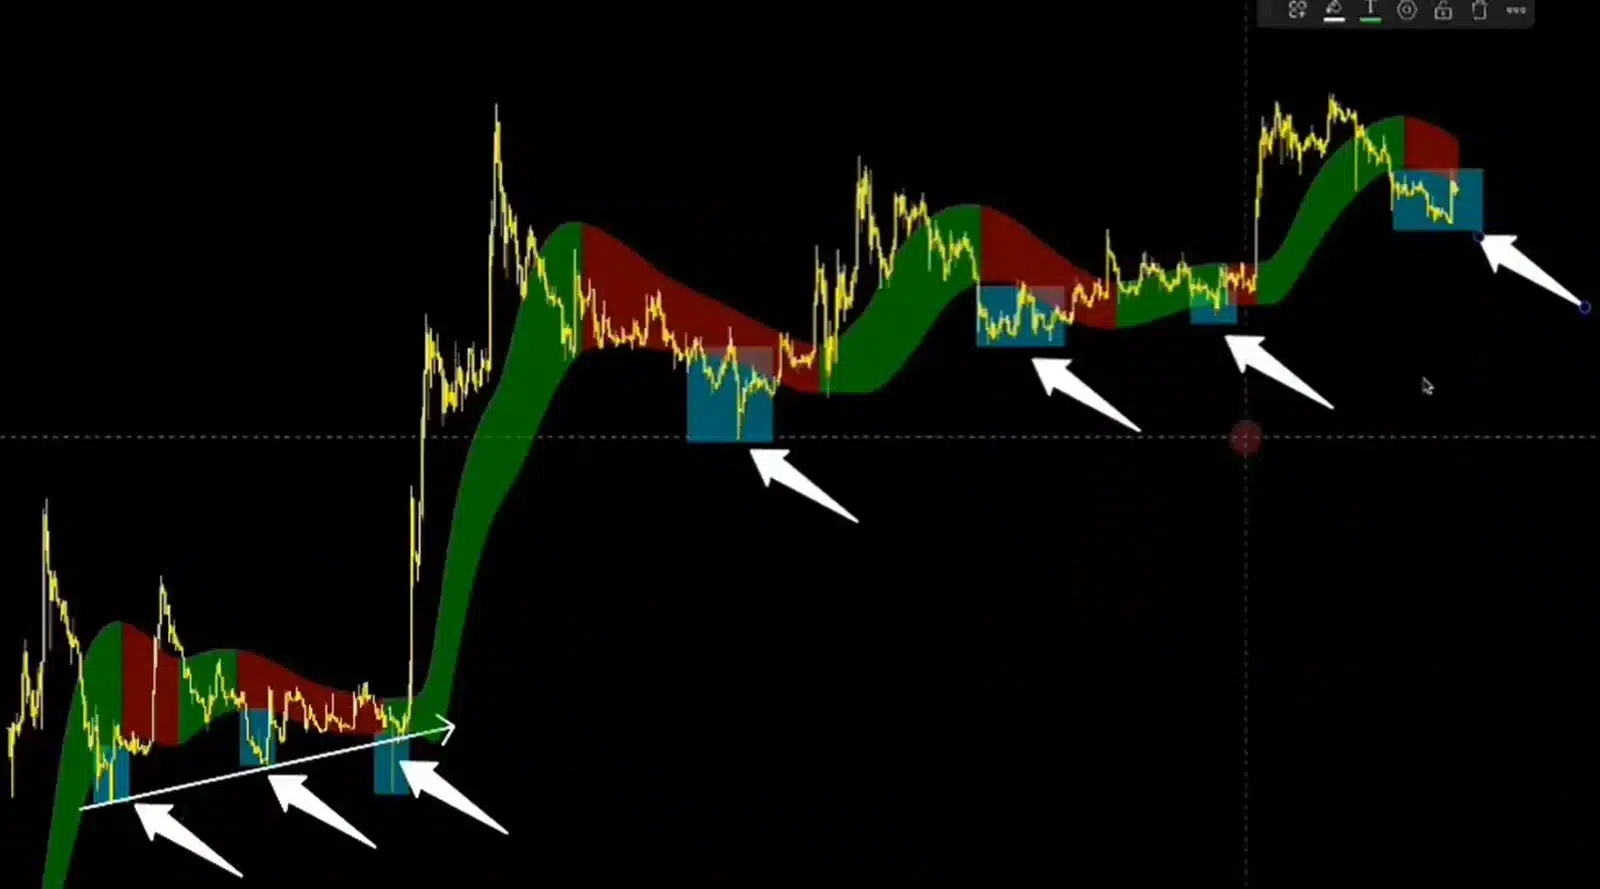
The Gaussian Channel tracks smoothed price movements while creating upper and lower boundaries around an asset’s prevailing trend. Traders use the indicator to measure momentum and identify periods when prices move beyond their established historical ranges.
We're back on X.
— 36Crypto (@36Crypto1) August 21, 2026
Our previous account (36crypto2) is currently unavailable while we continue working through the appeal process. In the meantime, this is our new official account. While you are on this page, please support us by sharing and following.
XRP’s position below the lower boundary currently signals weaker momentum compared with its broader weekly market trend. Nevertheless, ChartNerd interprets extended periods beneath that level as accumulation because previous occurrences preceded major price expansions.
Moreover, his chart covers nearly 14 years, capturing several bullish and bearish cycles across the cryptocurrency market. Each occurrence developed amid widely different liquidity levels, market participation, regulations, and broader economic conditions.
Significantly, those differences prevent traders from applying previous potential price targets directly to XRP’s current structure. Still, every earlier movement beneath the channel eventually transitioned into an important repricing phase, supporting ChartNerd’s central argument.
XRP must reclaim the lower boundary before buyers can confirm stronger weekly momentum and renewed market demand. A sustained recovery inside the channel would strengthen comparisons with previous cycles and improve the technical outlook.
Conversely, rejection near the lower boundary could prolong weakness and delay the anticipated repricing pattern. Hence, the Gaussian Channel provides useful historical context without establishing a guaranteed outcome or exact timetable.
Conclusion
XRP is repeating a rare formation that preceded every major repricing event identified in ChartNerd’s analysis. However, sustained demand and a confirmed channel recovery remain necessary before the pattern can support another major price surge.
Also Read: 21Shares Shatters XRP’s Biggest Myth About Ripple’s Control of the XRP Ledger
