


What to Know
- AWE has reclaimed the Bollinger Band midline, signaling improving bullish momentum after a recent pullback.
- RSI has recovered above 50, indicating buyers are gradually regaining market control without reaching overbought conditions.
- Holding above the $0.0585 support zone could open the path toward $0.070 and eventually the psychological $0.10 level.
AWE has resumed its recovery after rebounding from recent lows, with buyers defending key support levels despite heightened market volatility. TradingView data shows AWE trading around $0.0598, posting a 2.42% daily gain after bouncing from an intraday low of $0.0580.
The latest move has pushed the token back above the Bollinger Band midline, suggesting bullish momentum is gradually returning. Although AWE remains below the upper Bollinger Band, the recovery signals that buyers are attempting to regain control following a brief correction.
The Relative Strength Index (RSI) also supports the improving outlook. The indicator has climbed to 52.21, moving back above the neutral 50 level while remaining well below the overbought threshold of 70. This suggests there is still room for further upside if buying activity strengthens.
Also Read: Jelly-My-Jelly (JELLYJELLY) Price Prediction 2026–2030: Can JELLY Hit $0.10 Soon?
Market Structure and Price Action
We're back on X.
— 36Crypto (@36Crypto1) August 21, 2026
Our previous account (36crypto2) is currently unavailable while we continue working through the appeal process. In the meantime, this is our new official account. While you are on this page, please support us by sharing and following.
AWE experienced significant volatility throughout the past several months. Following a sharp rally earlier in the year, the token faced aggressive selling pressure that pushed prices back toward the lower Bollinger Band. However, buyers consistently stepped in around the $0.050–$0.051 region, preventing a deeper decline.
Since then, the market structure has gradually improved. AWE has established higher lows while reclaiming the Bollinger mid-band near $0.0586, signaling that short-term momentum is shifting back in favor of buyers.
The recent rebound from $0.0580 demonstrates that bulls remain active at lower levels. If price continues holding above the mid-band support, AWE could challenge the upper Bollinger Band around $0.0662, with a breakout potentially extending gains toward the next resistance zone.
Technical Analysis
Technical indicators are beginning to favor a bullish continuation, as the Bollinger Bands currently place the:
- Upper Band: $0.06619
- Middle Band (20 SMA): $0.05857
- Lower Band: $0.05095
Trading above the middle band generally reflects improving market sentiment. A sustained move toward the upper band would strengthen the bullish case, while a successful breakout above $0.066 could expose the psychological $0.070 level before targeting $0.10 over the longer term.
Momentum indicators also remain constructive. The RSI currently reads 52.21, while its signal line stands at 55.08. Although momentum remains moderate, the recovery above 50 indicates buyers are gradually regaining strength. A move above 60 would provide stronger confirmation of bullish continuation. On the downside, immediate support lies at $0.0586, followed by the lower Bollinger Band around $0.0510. Losing these levels could shift momentum back toward sellers.
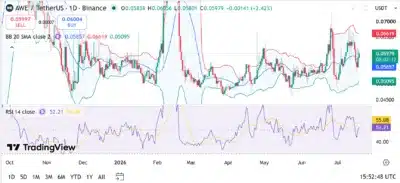
Source: Tradingview
AWE Price Predictions (2026–2030)
| Year | Minimum Price | Average Price | Maximum Price |
|---|---|---|---|
| 2026 | $0.052 | $0.067 | $0.090 |
| 2027 | $0.060 | $0.082 | $0.110 |
| 2028 | $0.072 | $0.100 | $0.135 |
| 2029 | $0.085 | $0.122 | $0.165 |
| 2030 | $0.100 | $0.150 | $0.200 |
Yearly Insights
2026
AWE could consolidate above the $0.058 support area while attempting to break through the $0.070 resistance before targeting $0.09.
2027
Greater market participation and improving investor sentiment may help AWE extend gains toward $0.11.
2028
If the broader cryptocurrency market enters another bullish cycle, AWE could climb above the $0.13 region.
2029
Continued ecosystem development and stronger liquidity may support a sustained rally toward $0.165.
2030
Under favorable market conditions, AWE could establish a longer-term uptrend and approach the $0.20 milestone.
Conclusion
AWE has regained positive momentum after reclaiming the Bollinger Band midline, an encouraging signal that buyers are rebuilding strength. The RSI has recovered above the neutral 50 level, confirming improving momentum while leaving room for further appreciation before entering overbought territory.
The $0.0586 level remains the most important support to watch. Holding above this zone could allow AWE to retest $0.066, with a successful breakout increasing the probability of reaching $0.070 and eventually the psychological $0.10 target. While price volatility remains a factor, the current technical setup favors a cautiously bullish outlook.
FAQs
1. What is AWE’s immediate support level?
The nearest support is around $0.0586, which aligns with the Bollinger Band midline.
2. What is AWE’s next major resistance?
The first resistance sits near $0.0662, followed by the psychological $0.070 level.
3. What does the RSI indicate for AWE?
The RSI reading of 52.21 signals improving bullish momentum while remaining below overbought conditions.
4. Why is the Bollinger mid-band important?
The Bollinger mid-band often acts as dynamic support or resistance and helps identify whether buyers or sellers are controlling the trend.
5. Can AWE reach $0.10?
If AWE maintains support above $0.0586 and breaks above $0.066, the technical structure suggests a move toward $0.10 is achievable over the longer term.
Also Read: SpaceX (SPCX) Price Prediction 2026–2030: Can SPCX Hit $250 Soon?
