


Cardano (ADA) is showing signs of instability after briefly plunging to $0.516 during early trading. The cryptocurrency staged a modest recovery to around $0.548, but intense selling pressure continues to cap upside attempts.
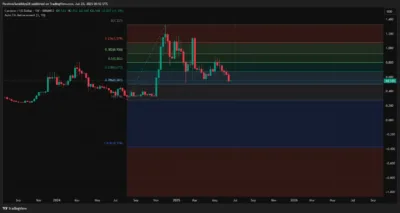
The recent price action follows a sharp decline that broke through multiple support levels, sparking concern across the market. ADA now trades just above the crucial $0.50–$0.52 support zone, a level that aligns with the 0.786 Fibonacci retracement on the weekly chart.
This area has historically acted as a turning point, signaling either the start of a rebound or deeper losses.
Source: Tradingview
On the higher time frame, Cardano has lost over 60 percent since reaching $1.327 earlier this cycle, making the current movement near $0.501 critical. A breakdown below this threshold could lead to fresh lows between $0.42 and $0.45, while a successful hold could trigger a short-term relief bounce targeting the $0.60–$0.68 range.
Also Read: XRP Community Erupts as Viral 3-Word Challenge Sparks Bold Investor Reactions
Traders Eye Volume Breakout as Key Technical Zones Tighten
We're back on X.
— 36Crypto (@36Crypto1) August 21, 2026
Our previous account (36crypto2) is currently unavailable while we continue working through the appeal process. In the meantime, this is our new official account. While you are on this page, please support us by sharing and following.
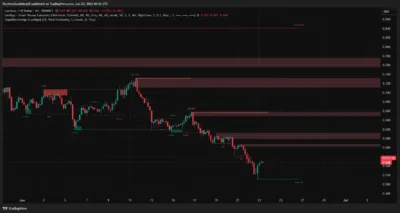
Short-term charts show complex price behavior marked by smart money signals such as a Break of Structure and a Change of Character. These patterns have emerged around supply zones at $0.58, $0.63, and $0.66. Liquidity sweeps below recent lows, followed by a minor bullish shift, suggesting larger players may be positioning against weak hands.
Source: Tradingview
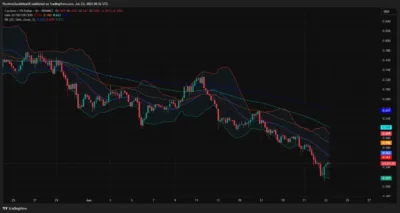
Technical indicators remain deeply bearish, with Bollinger Bands on the 4-hour chart narrowing as price struggles at the mid-band. Stacked above ADA are 20, 50, 100, and 200 EMAs, with immediate resistance at the current level of $0.561. It is unlikely that the price will weaken that far until that point is regained.
Source: Tradingview
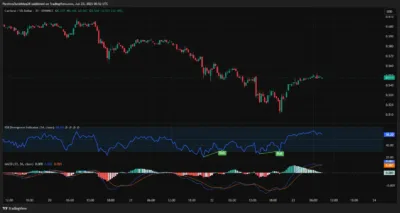
The RSI is lower in timeframes at 58.20 after a mild divergence, while the MACD signals weak buying momentum. The Supertrend and Parabolic SAR, which are bearish as well, further support the downtrend.
Source: Tradingview
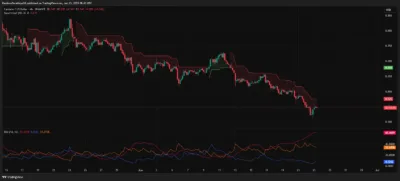
Other bearish indicators are in the DMI, where the -DI is still leading its +DI counterpart, with the ADX rising. This situation usually augers well for an ongoing bearish trend. The Money Flow Index is found to be weak, suggesting that buyer participation is low.
Source: Tradingview
If bulls fail to defend the $0.50 level, ADA could quickly revisit $0.475 and possibly fall toward the $0.42–$0.45 demand area. Nevertheless, if the token reclaims the price of $0.561 with the support of the volumes, it can make an effort to break out around $0.622 and above.
Conclusion
Cardano stands at a critical junction as it flirts with a breakdown from key support. Whether ADA rebounds or faces a steep decline hinges on its performance around the $0.50 mark in the coming sessions.
Also Read: Pundit Says Iran Triggered a Global Reset and XRP Was Designed for the Moment — Here’s What It Means
