

What to Know
-
Wiki Cat trades near $0.000000060469, with its daily chart showing prolonged bearish pressure following a substantial August price rally.
-
WKC’s RSI stands at 42.80, indicating weak buying momentum, while narrowing Bollinger Bands reflect reduced volatility across recent trading sessions.
-
Holding above $0.000000057998 could support recovery toward $0.000000070442, while further selling pressure may expose lower support levels around $0.00000005.
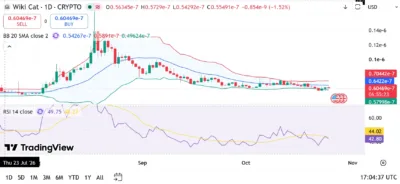
Wiki Cat (WKC) trades near $0.000000060469, with its daily chart showing prolonged consolidation following a substantial bullish rally recorded in August. According to the TradingView chart, WKC remains below its 20-day Bollinger Band average at $0.00000006422, while the latest daily candle reflects a 1.52% decline.
Recent trading activity has kept WKC within a relatively narrow price range, reflecting reduced market volatility following several months of declining prices. The cryptocurrency previously experienced a substantial breakout that pushed its price above $0.00000012 before sellers regained control and triggered a prolonged correction.
The Relative Strength Index stands at 42.80, below its moving average of 44.02, indicating weak buying momentum. This positioning suggests that sellers retain an advantage, although the narrowing trading range could precede another significant price movement.
Also Read: SKYAI (SKYAI) Price Prediction 2026–2030: Can SKYAI Reach $1 Soon?
Market Structure and Price Action
WKC’s daily chart shows relatively subdued trading throughout late July before a substantial bullish breakout pushed prices above $0.00000010 during August. The rally produced several strong bullish candles, with prices eventually approaching the $0.00000014 region before buying momentum weakened.
Following the initial surge, WKC experienced a prolonged correction, with successive bearish candles pushing prices below $0.00000010 and eventually toward the $0.00000006 region. The decline established a series of lower highs, reflecting persistent selling pressure throughout September.
We're back on X.
— 36Crypto (@36Crypto1) August 21, 2026
Our previous account (36crypto2) is currently unavailable while we continue working through the appeal process. In the meantime, this is our new official account. While you are on this page, please support us by sharing and following.
Recent trading sessions have shown relatively limited price movement, with WKC consolidating near $0.000000060469. Buyers have struggled to establish a sustained recovery, while sellers have repeatedly prevented meaningful advances above nearby resistance levels.
Maintaining support around $0.000000057998 could allow WKC to challenge the Bollinger Band midline at $0.00000006422, followed by resistance near $0.000000070442. A sustained breakout above these levels could expose additional resistance around $0.00000008. Conversely, a breakdown below $0.000000057998 could expose psychological support around $0.000000055 and potentially $0.00000005, particularly if selling pressure intensifies.
Bollinger Bands Indicate Reduced Market Volatility
WKC trades below its Bollinger Band midline at $0.00000006422, indicating continued weakness following the cryptocurrency’s prolonged correction. The current price remains above the lower Bollinger Band at $0.000000057998, placing the asset within the lower portion of its recent trading range.
The upper Bollinger Band stands near $0.000000070442, creating a relatively narrow range compared with the substantial volatility recorded during August. The contraction suggests that price fluctuations have moderated as market participants await a stronger directional movement.
A sustained breakout above $0.000000070442 could strengthen bullish expectations and potentially expose resistance around $0.00000008 and $0.00000010. Breaking above these levels would improve the possibility of challenging the previous August trading range.
Reaching $0.00000010 would require an increase of approximately 65.37% from the displayed price of $0.000000060469, while reaching $0.000001 would require approximately 1,553.74% growth. Nevertheless, failure to recover above the Bollinger Band midline could maintain bearish pressure and expose WKC to another correction toward $0.000000057998.
RSI Signals Weak Buying Momentum
The RSI reading of 42.80 indicates subdued market momentum, with the indicator positioned below the neutral threshold of 50. Its position beneath the moving average of 44.02 further reflects continued weakness in buying activity following the prolonged price decline.
The indicator previously reached elevated levels during WKC’s substantial August breakout before declining as sellers regained control. Momentum subsequently weakened throughout September, with the RSI frequently remaining below the neutral threshold.
Recent trading activity has produced relatively modest RSI fluctuations, suggesting that neither buyers nor sellers have established a decisive short-term advantage. Nevertheless, the indicator’s position below 50 continues to favor a cautious bearish outlook.
A sustained recovery above 50 could strengthen bullish expectations, particularly if WKC breaks above resistance around $0.00000006422. Further improvement toward 60 would support the possibility of challenging the upper Bollinger Band at $0.000000070442.
Conversely, a decline toward 40 could indicate increasing selling pressure, while further deterioration toward 30 would raise the possibility of another substantial correction. For WKC to establish a stronger bullish structure, buyers would need to reclaim $0.00000006422 before challenging $0.000000070442 and potentially advancing toward $0.00000008.
Source: TradingView
WKC Price Predictions (2026–2030)
| Year | Minimum Price | Average Price | Maximum Price |
|---|---|---|---|
| 2026 | $0.000000045 | $0.000000065 | $0.00000010 |
| 2027 | $0.00000005 | $0.00000010 | $0.00000020 |
| 2028 | $0.00000006 | $0.00000018 | $0.00000040 |
| 2029 | $0.00000008 | $0.00000030 | $0.00000070 |
| 2030 | $0.00000010 | $0.00000055 | $0.00000100 |
Yearly Insights
2026
WKC’s remaining 2026 outlook depends on maintaining support around $0.000000057998 and overcoming resistance near $0.000000070442. A sustained recovery could support an advance toward $0.00000008 and potentially $0.00000010, while renewed selling pressure could expose the $0.00000005 and $0.000000045 regions.
2027
Improving cryptocurrency market conditions and stronger demand for WKC could support an advance toward $0.00000020 under a bullish scenario. Establishing support above $0.00000010 would strengthen this possibility, although weaker market participation and declining liquidity could restrict prices to lower trading ranges.
2028
A broader cryptocurrency market expansion could allow WKC to challenge $0.00000040 if buying activity and trading liquidity strengthen. Reaching this level would require substantial appreciation from current prices, while unfavorable market conditions could keep the cryptocurrency considerably below its projected bullish target.
2029
The bullish scenario places WKC near $0.00000070 if sustained demand and favorable cryptocurrency market conditions support additional appreciation. Nevertheless, prolonged bearish conditions or declining liquidity could limit price movement toward the lower projected range around $0.00000008.
2030
A favorable long-term scenario allows WKC to approach $0.000001, provided sustained demand, improved liquidity and broader market participation support substantial appreciation. Achieving this target would require an increase of approximately 1,553.74% from the displayed price, making it a highly speculative outcome rather than a confirmed technical projection.
Conclusion
WKC continues to experience weak short-term momentum, with its price trading near $0.000000060469 following a 1.52% daily decline. The cryptocurrency remains below its Bollinger Band midline at $0.00000006422, while the RSI reading of 42.80 indicates subdued buying activity.
A sustained breakout above $0.000000070442 could support further gains toward $0.00000008 and $0.00000010, potentially opening a path toward higher resistance levels. Conversely, losing support around $0.000000057998 could expose WKC to another correction toward $0.00000005.
The $0.000001 target remains a speculative long-term scenario rather than a confirmed technical projection, with future performance dependent on sustained demand, market liquidity and broader cryptocurrency conditions.
FAQs
1. What is the immediate support level for WKC?
The nearest technical support stands around $0.000000057998, corresponding to the lower Bollinger Band, followed by potential psychological support around $0.000000055. A sustained breakdown could expose additional support near $0.00000005.
2. What is the next major resistance for WKC?
WKC faces immediate resistance near $0.00000006422, corresponding to the Bollinger Band midline, followed by the upper Bollinger Band at $0.000000070442. Breaking above these levels could expose $0.00000008 and potentially $0.00000010.
3. What does WKC’s RSI indicate?
The RSI reading of 42.80 indicates weak buying momentum, with the indicator positioned below the neutral threshold of 50. Its position beneath the moving average of 44.02 reflects continued bearish pressure following the prolonged correction.
4. Can WKC reach $0.000001 before 2030?
WKC could theoretically reach $0.000001 under exceptionally favorable market conditions, although achieving this target would require approximately 1,553.74% growth from its displayed price. Sustained buying pressure, stronger liquidity and substantial market participation would be necessary, making the target highly speculative.
5. Why is the Bollinger Band midline important?
The Bollinger Band midline at $0.00000006422 represents WKC’s 20-day moving average and serves as a potential resistance level during recovery attempts. Trading above this level would indicate improving short-term momentum, while remaining beneath it could maintain bearish pressure.
Also Read: Artificial Inu (AI) Price Prediction 2026–2030: Can AI Reach $1 Soon?
